Green
The Carbon Footprint of the Food Supply Chain
Which Foods Have the Greatest Environmental Impact?
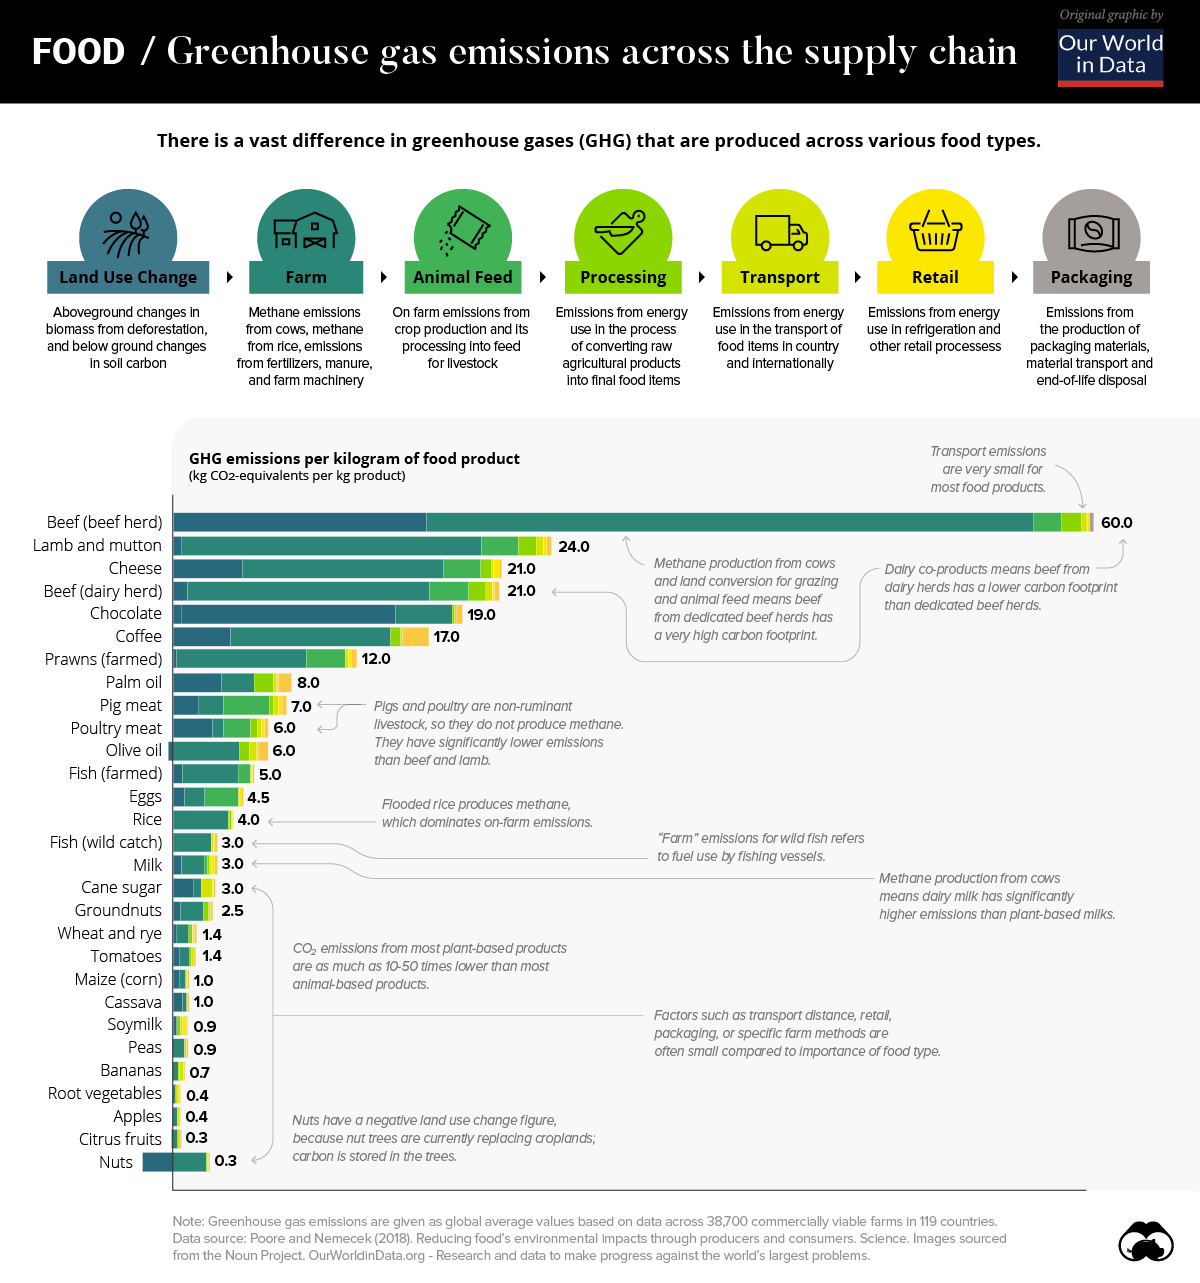
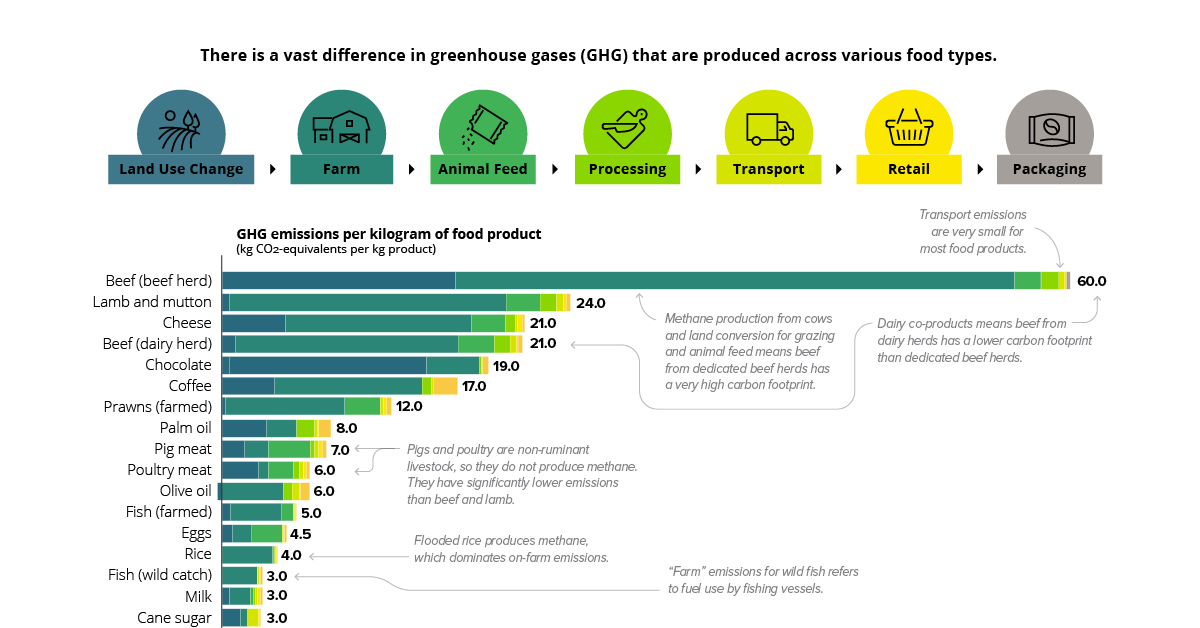
The quantity of greenhouse gases (GHGs) generated by our food can vary considerably across the global food supply chain.
In fact, the difference between specific food types can vary by orders of magnitude, meaning what we eat could be a significant factor impacting GHG emissions on the environment.
Today’s modified chart from Our World in Data relies on data from the largest meta-analysis of food systems in history. The study, published in Science was led by Joseph Poore and Thomas Nemecek to highlight the carbon footprint across different food types across the world.
The Foods With the Highest Carbon Footprint
Worldwide, there are approximately 13.7 billion metric tons of carbon dioxide equivalents (CO2e) emitted through the food supply chain per year.
Across a database extending through 119 countries and 38,000 commercial farms, the study found that, unsurprisingly, beef and other animal products have an outsize effect on emissions.
For example, one kilogram (kg) of beef results in 60 kg of GHG emissions—nearly 2.5x the closest food type, lamb and mutton. In contrast, the same weight of apples produce less than one kilogram of GHG emissions.
| Food Type | GHG Emissions per 1 kg Produced |
|---|---|
| Beef (beef herd) | 60 kgCO2e |
| Lamb & Mutton | 24 kgCO2e |
| Cheese | 21 kgCO2e |
| Beef (dairy herd) | 21 kgCO2e |
| Chocolate | 19 kgCO2e |
| Coffee | 17 kgCO2e |
| Prawns (farmed) | 12 kgCO2e |
| Palm Oil | 8 kgCO2e |
| Pig Meat | 7 kgCO2e |
| Poultry Meat | 6 kgCO2e |
| Olive Oil | 6 kgCO2e |
| Fish (farmed) | 5 kgCO2e |
| Eggs | 4.5 kgCO2e |
| Rice | 4 kgCO2e |
| Fish (wild catch) | 3 kgCO2e |
| Milk | 3 kgCO2e |
| Cane Sugar | 3 kgCO2e |
| Groundnuts | 2.5 kgCO2e |
| Wheat & Rye | 1.4 kgCO2e |
| Tomatoes | 1.4 kgCO2e |
| Maize (Corn) | 1.0 kgCO2e |
| Cassava | 1.0 kgCO2e |
| Soymilk | 0.9 kgCO2e |
| Peas | 0.9 kgCO2e |
| Bananas | 0.7 kgCO2e |
| Root Vegetables | 0.4 kgCO2e |
| Apples | 0.4 kgCO2e |
| Citrus Fruits | 0.3 kgCO2e |
| Nuts | 0.3 kgCO2e |
When it comes to plant-based foods, chocolate is among the highest GHG emitters. One kilogram of chocolate produces 19 kg of GHGs. On average, emissions from plant-based foods are 10 to 50 times lower than animal-based types.
Bottom line, it is clear that the spectrum of emissions differs significantly across each food type.
Food Supply Chain Stages
The food supply chain is complex and nuanced as it moves across each stage of the cycle.
Although the steps behind the supply chain for individual foods can vary considerably, each typically has seven stages:
- Land Use Change
- Farm
- Animal Feed
- Processing
- Transport
- Retail
- Packaging
Across all foods, the land use and farm stages of the supply chain account for 80% of GHG emissions. In beef production, for example, there are three key contributing factors to the carbon footprint at these stages: animal feed, land conversion, and methane production from cows. In the U.S., beef production accounts for 40% of total livestock-related land use domestically.
On the other end of the spectrum is transportation. This stage of the supply chain makes up 10% of total GHG emissions on average. When it comes to beef, the proportion of GHGs that transportation emits is even smaller, at just 0.5% of total emissions.
Contrary to popular belief, sourcing food locally may not help GHG emissions in a very significant way, especially in the case of foods with a large carbon footprint.
The Rise of Plant-Based Alternatives
Amid a growing market share of plant-based alternatives in markets around the world, the future of the food supply chain could undergo a significant transition.
For investors, this shift is already evident. Beyond Meat, a leading provider of meat substitutes, was one of the best performing stocks of 2019—gaining 202% after its IPO in May 2019.
As rising awareness about the environment becomes more prevalent, is it possible that growing meat consumption could be a thing of the past?


Green
The Carbon Footprint of Major Travel Methods
Going on a cruise ship and flying domestically are the most carbon-intensive travel methods.


The Carbon Footprint of Major Travel Methods
This was originally posted on our Voronoi app. Download the app for free on iOS or Android and discover incredible data-driven charts from a variety of trusted sources.
Did you know that transport accounts for nearly one-quarter of global energy-related carbon dioxide (CO₂) emissions?
This graphic illustrates the carbon footprints of major travel methods measured in grams of carbon dioxide equivalent (CO₂e) emitted per person to travel one kilometer. This includes both CO₂ and other greenhouse gases.
Data is sourced from Our World in Data, the UK Government’s Department for Energy Security and Net Zero, and The International Council on Clean Transportation, as of December 2022.
These figures should be interpreted as approximations, rather than exact numbers. There are many variables at play that determine the actual carbon footprint in any individual case, including vehicle type or model, occupancy, energy mix, and even weather.
Cruise Ships are the Most Carbon-Intensive Travel Method
According to these estimates, taking a cruise ship, flying domestically, and driving alone are some of the most carbon-intensive travel methods.
Cruise ships typically use heavy fuel oil, which is high in carbon content. The average cruise ship weighs between 70,000 to 180,000 metric tons, meaning they require large engines to get moving.
These massive vessels must also generate power for onboard amenities such as lighting, air conditioning, and entertainment systems.
Short-haul flights are also considered carbon-intensive due to the significant amount of fuel consumed during initial takeoff and climbing altitude, relative to a lower amount of cruising.
| Transportation method | CO₂ equivalent emissions per passenger km |
|---|---|
| Cruise Ship | 250 |
| Short-haul flight (i.e. within a U.S. state or European country) | 246 |
| Diesel car | 171 |
| Gas car | 170 |
| Medium-haul flight (i.e. international travel within Europe, or between U.S. states) | 151 |
| Long-haul flight (over 3,700 km, about the distance from LA to NY) | 147 |
| Motorbike | 113 |
| Bus (average) | 96 |
| Plug-in hybrid | 68 |
| Electric car | 47 |
| National rail | 35 |
| Tram | 28 |
| London Underground | 27 |
| Ferry (foot passenger) | 19 |
| Eurostar (International rail) | 4.5 |
Are EVs Greener?
Many experts agree that EVs produce a lower carbon footprint over time versus traditional internal combustion engine (ICE) vehicles.
However, the batteries in electric vehicles charge on the power that comes straight off the electrical grid—which in many places may be powered by fossil fuels. For that reason, the carbon footprint of an EV will depend largely on the blend of electricity sources used for charging.
There are also questions about how energy-intensive it is to build EVs compared to a comparable ICE vehicle.

-

 Markets6 days ago
The Best U.S. Companies to Work for According to LinkedIn
-

 VC+2 weeks ago
VC+: Get Our Key Takeaways From the IMF’s World Economic Outlook
-

 Demographics2 weeks ago
The Countries That Have Become Sadder Since 2010
-

 Money2 weeks ago
Charted: Who Has Savings in This Economy?
-

 Technology2 weeks ago
Visualizing AI Patents by Country
-

 Economy2 weeks ago
Economic Growth Forecasts for G7 and BRICS Countries in 2024
-

 Wealth1 week ago
Charted: Which City Has the Most Billionaires in 2024?
-

 Technology1 week ago
All of the Grants Given by the U.S. CHIPS Act